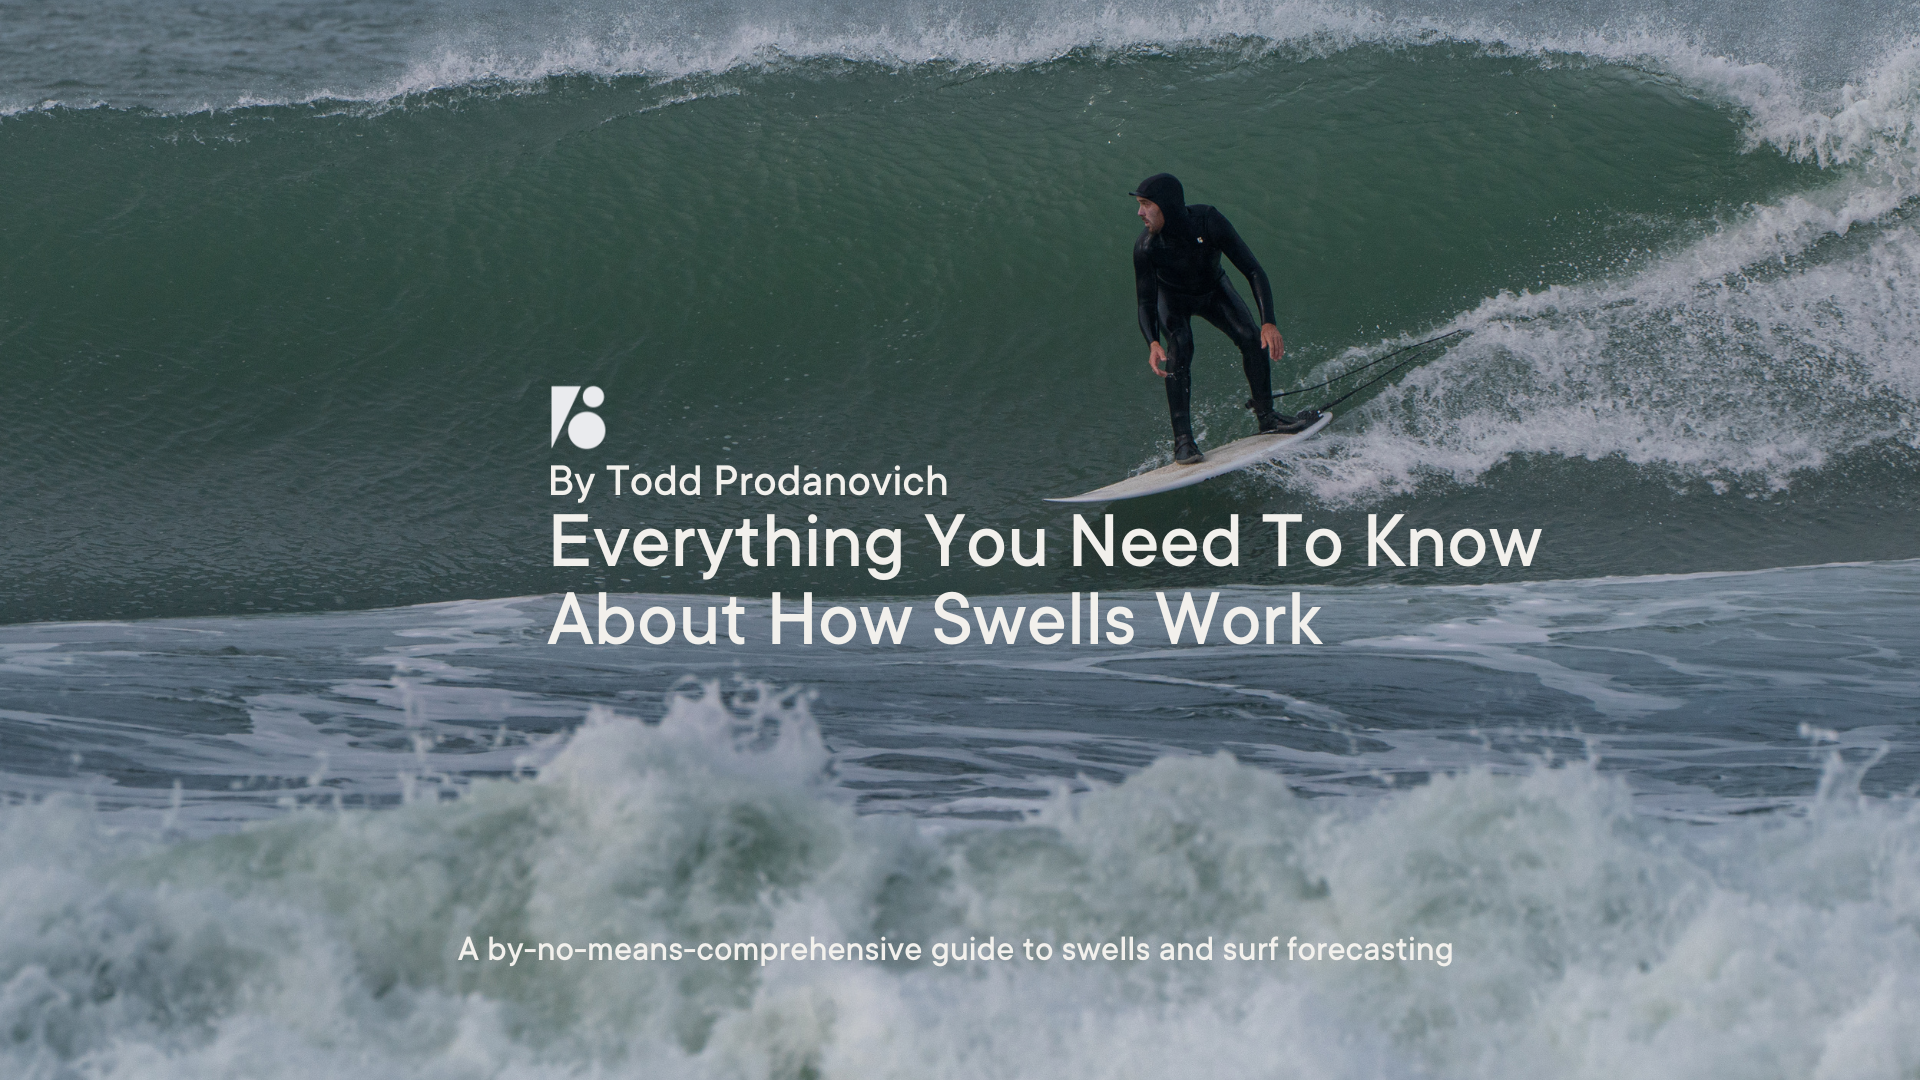
By Todd Prodanovich
As a grom, I had no interest whatsoever in swell charts. Direction, period, primary vs. secondary—if it came from a buoy in numerical form, it made my eyes instantly glaze over. That stuff felt like math—dense, stale and boring—the furthest thing imaginable from the rapturous, freeform expression of actually riding waves. Besides, the color of the little bar on Surfline tells you the important part, right?

Well, I guess that depends on how much free time you have, and how much of it you want to put toward surfing better waves. Many people, including longtime and/or extremely skilled surfers, never dive any deeper than Surfline’s colored bar and the number right beneath it. Especially if you’re time-poor, squeezing in sessions around work or childcare, why sweat the details? It’s the ocean, it’ll be somewhat fun regardless. But as someone who eventually did cross over to the chart nerd side of surfing, I would highly recommend it to any surfer who has the time.

What follows is a by-no-means-comprehensive guide to swells and surf forecasting to help you make some sense out of all those charts and numbers. If you’re new to surfing, absorbing this info should place you in the vicinity of fun waves somewhat more often. And if you’re old to surfing and just couldn’t be bothered learning this stuff until now, there’s hope for you yet.

A Swell Is Born
Think of the ocean as a swimming pool, and a storm as a kid doing a cannonball in the deep end—the energy that ripples outward in all directions is swell. The size of a swell increases with the storm’s fetch (size of the body of water affected by its wind), wind speed and duration. Wind blows on the water to kick up waves, those waves overtake each other to become bigger waves, and eventually they organize into swell. The further a swell travels, the “cleaner” it tends to be (a groundswell formed by a storm 2,000 miles away has a lot of time for surface chops and bumps to settle down, while a local windswell from a few miles offshore is gonna be extra chunky).
How The Surf Forecast Sausage Gets Made
Whether you’re talking about mainstage headliner Surfline, an indie act like Wavecast, or anything in between, all surf forecasts rely on meteorological data collected by agencies like the National Oceanic and Atmospheric Administration (NOAA)—especially readings from buoys that dot the coast. As a swell approaches land, it jostles these buoys along the way, with each one measuring the size of the waves in the swell, the length of time between each of them (the period) and then transmitting this data back to the mainland every hour. There are other sources of information that go into forecasting models, but the buoys are the meat and potatoes.
Forecasting Terms To Know
- Swell Height/Size: An average trough-to-crest (bottom of the wave face to its highest point) measurement of open-ocean waves passing a buoy in a given hour. The ocean is a busy place swell-wise, so there are usually primary and secondary swells being measured by the buoys, which all show up distinctively in swell charts. It’s important to keep in mind that swell size is different from the size of the waves that actually show up at your beach. That’s because much of the energy of open-ocean swells is moving below the surface, and once that energy hits shallower water, it’s forced upward into a larger wave (bonus term: this is called “shoaling”). So when you’re looking at the charts, know that what looks like a measly, 2-foot swell could very well produce fun, shoulder-high surf once it makes landfall.

- Period/Interval: People use these terms interchangeably, and both refer to the amount of time between the crests of waves in a swell, described in seconds (as in: 3ft at 8s WNW 283º). A longer period means that a swell is traveling from further away, contains more power, and will generally produce bigger, less-consistent waves. A shorter period means that waves will come in more consistently, but will be weaker and usually smaller. Most surfers refer to “short-period swells” as anything with a period of 10 seconds or less. “Long-period swells” are over 10 seconds.

- Windswell: Any short-period swell, which is created by local winds rather than by far-off storm systems. Some surfers think of these as lower-quality swells, as they can often be bumpy/messy, but it really just depends on where you’re surfing. Many of the California beach breaks that get completely overwhelmed and closed out during long-period swells will be peaky and fun on certain windswells.
- Groundswell: Any long-period swell, which is generated by a far-off storm. These are the more sizable, organized swells that turn reefs and points into clean, cartoonishly-perfect walls (again, while overpowering most beach breaks).
- Swell Direction: The direction of a swell’s origin, not the direction it’s heading (so winter swells in California are typically west/northwest, as the North Pacific is where the swell-generating storm action is). In charts, swell direction is described in degrees, with 0 degrees representing north, 90º east, 180º south and 270º west. Depending on the direction a break is facing and the orientation of things below the surface (reef, cobblestones, sandbars, etc.), it will break differently depending on the swell direction (or combination of swell directions). Looking at a map can give you a good sense of what swell directions a spot is most exposed to, and if any headlands or islands are acting as a barrier for swell (this is called “shadowing”).
- Tide: Goes in and out every 6ish hours as the earth rotates and the ocean feels the pull of the moon’s gravity, affecting the surf in myriad ways in the process. Different breaks are better on low, medium or high tides depending on the bottom contours of that specific spot, but there’s no universal rule of a certain tide being good or bad for surf. You just have to watch how it affects your spot in particular.
- Wind: Just like swell direction, in forecasting, wind direction is referred to by its origin, not where it’s going (using degrees for direction, and knots for intensity). When talking about local wind conditions that you’re actually surfing in (not far-off, swell generating winds), light offshore winds (blowing from the beach toward the waves) are generally considered ideal, with glassy conditions (no wind) right up there with it. Onshore winds cause waves to crumble earlier and close out, so aren’t ideal (unless you can do airs, in which case they help the board stick to your feet—or so I’ve heard). In Southern California, for example, the rare Santa Ana winds originate in the east (90º, give or take) and blow west—offshore and dreamy for the region’s majority west-facing beaches. This is an east wind, even though it’s blowing west, because east is where it’s coming from.
Know The Limitations Of Forecasting
The reason people get frustrated with surf forecasts is that there’s only so much data available for them to plug into their computer models, and while they do a very impressive job of creating a rough sketch of how the surf will be in a general area, the devil is in the details when it comes to what makes a specific break any good. It would take an army of citizen scientists, surfing every break during every variation of swell, wind and tide, then incorporating reports from their experiences into a model for it to create a more accurate forecast for every spot. In other words, don’t hold your breath. Instead...
Gather Your Own Data
For better or worse, there are no shortcuts in surfing. Just like you need to pearl 100 times before you ride one to the beach, or get lipped in the head 1,000 times before you make a decent barrel, you need to look at a whole lot of swell charts before they become practically useful in your quest for better waves. But one easy way to learn what brings your favorite spot to life is to surf there often, and whenever you have a fun session, take a screenshot of the swell chart as soon as you get home. Maybe keep those screenshots in a folder and rename each one based on the conditions (like “shoulder-high and peaky” or preferably “life-altering dream barrels”). It will take a while to start recognizing the swell direction, period and local conditions that you like in the charts, but you’ll get better as you go, and surf better waves in the process. So, yeah, totally worth it.
---
Todd Prodanovich is the former editor-in-chief of Surfer magazine, where he spent a decade covering far-flung surf zones, social justice in the surf community, environmental movements and much more. He is a co-founder of Rock Paper Creative, a creative agency conveniently based near all his favorite waves in San Diego, CA.